The
Cerebro Dashboard project allows managers and senior leadership to place livestreams,
critical reports, and additional information on a video wall for easy access.
In this project, I developed a reusable canvas-like component that allows placement of rectangular
cards anywhere on the screen. You can add/customize the datasources easily. You can make the component
render your own custom video/report component. In fact, the canvas can be configured to render any
custom
HTML component.
Live Demo;
To create this component, I successfully designed a backend to store the screen data and more
importantly
successfully manage the UI/UX state of the canvas. The biggest challenge was designing a JS class that
managed
the complex states of the UI. The class could also be extended easily to implement new functionality
that users requested.
Vanilla JS;JQuery;HTML;CSS;UI/UX;UI State management;Local Storage;
C#;dot NET MVC;SQL;
Telerik Kendo UI
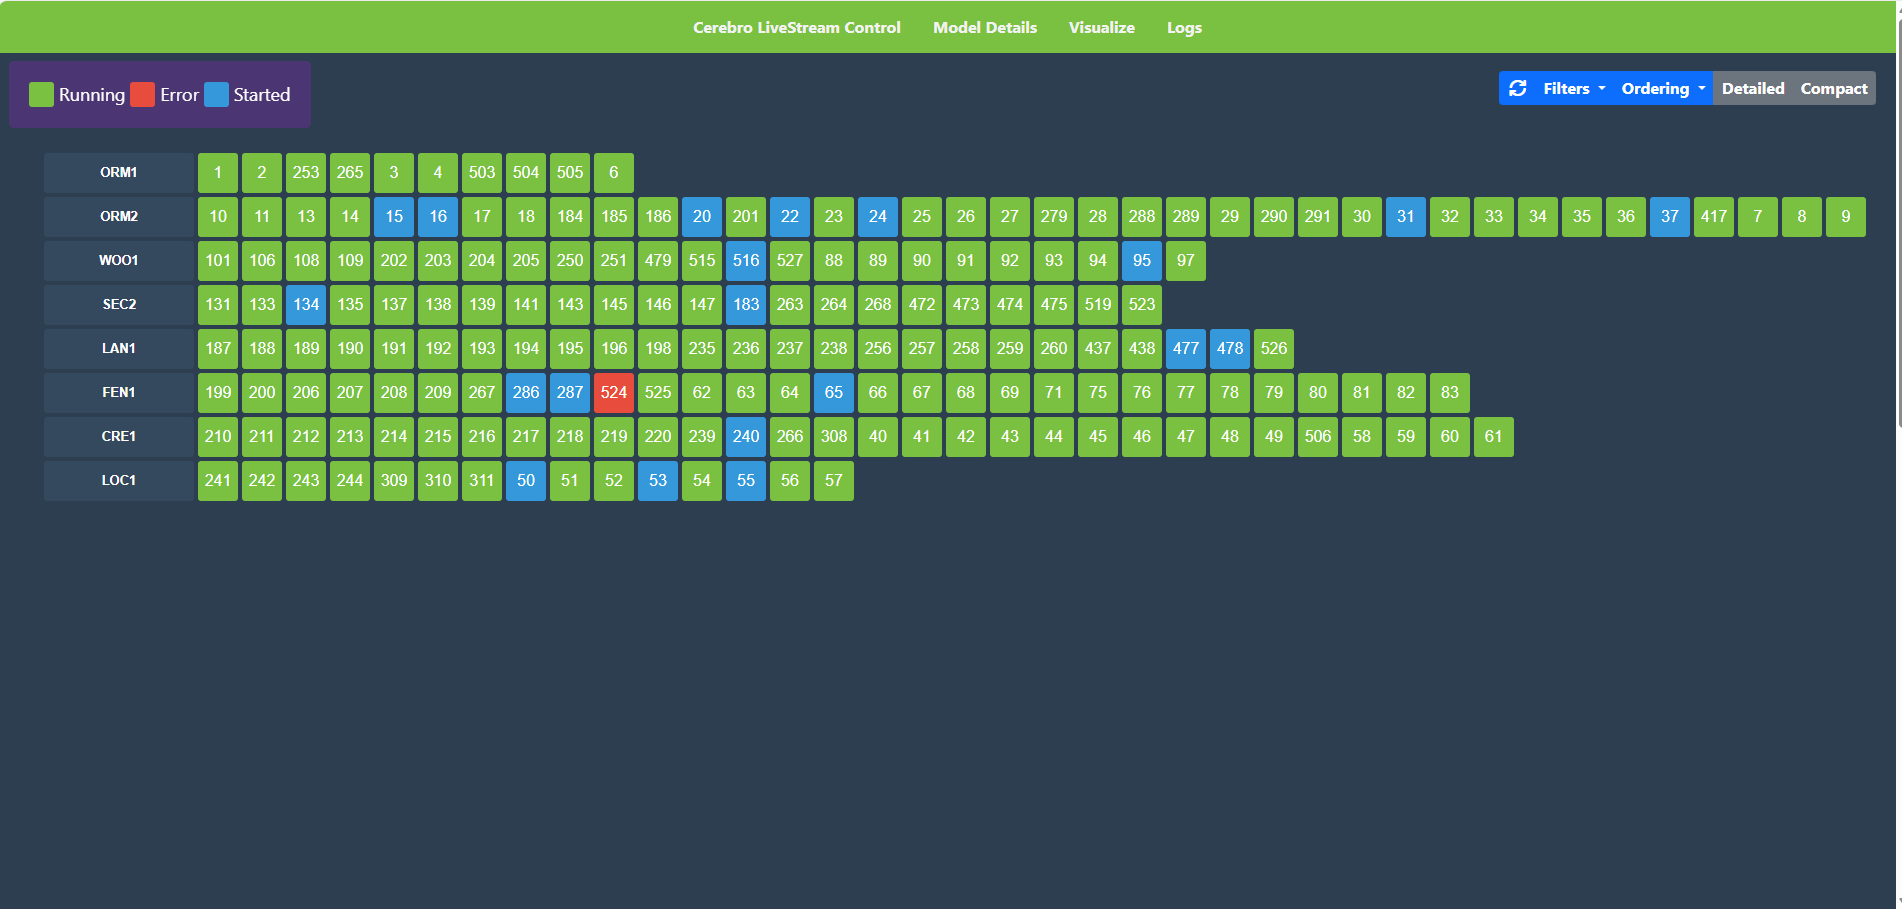
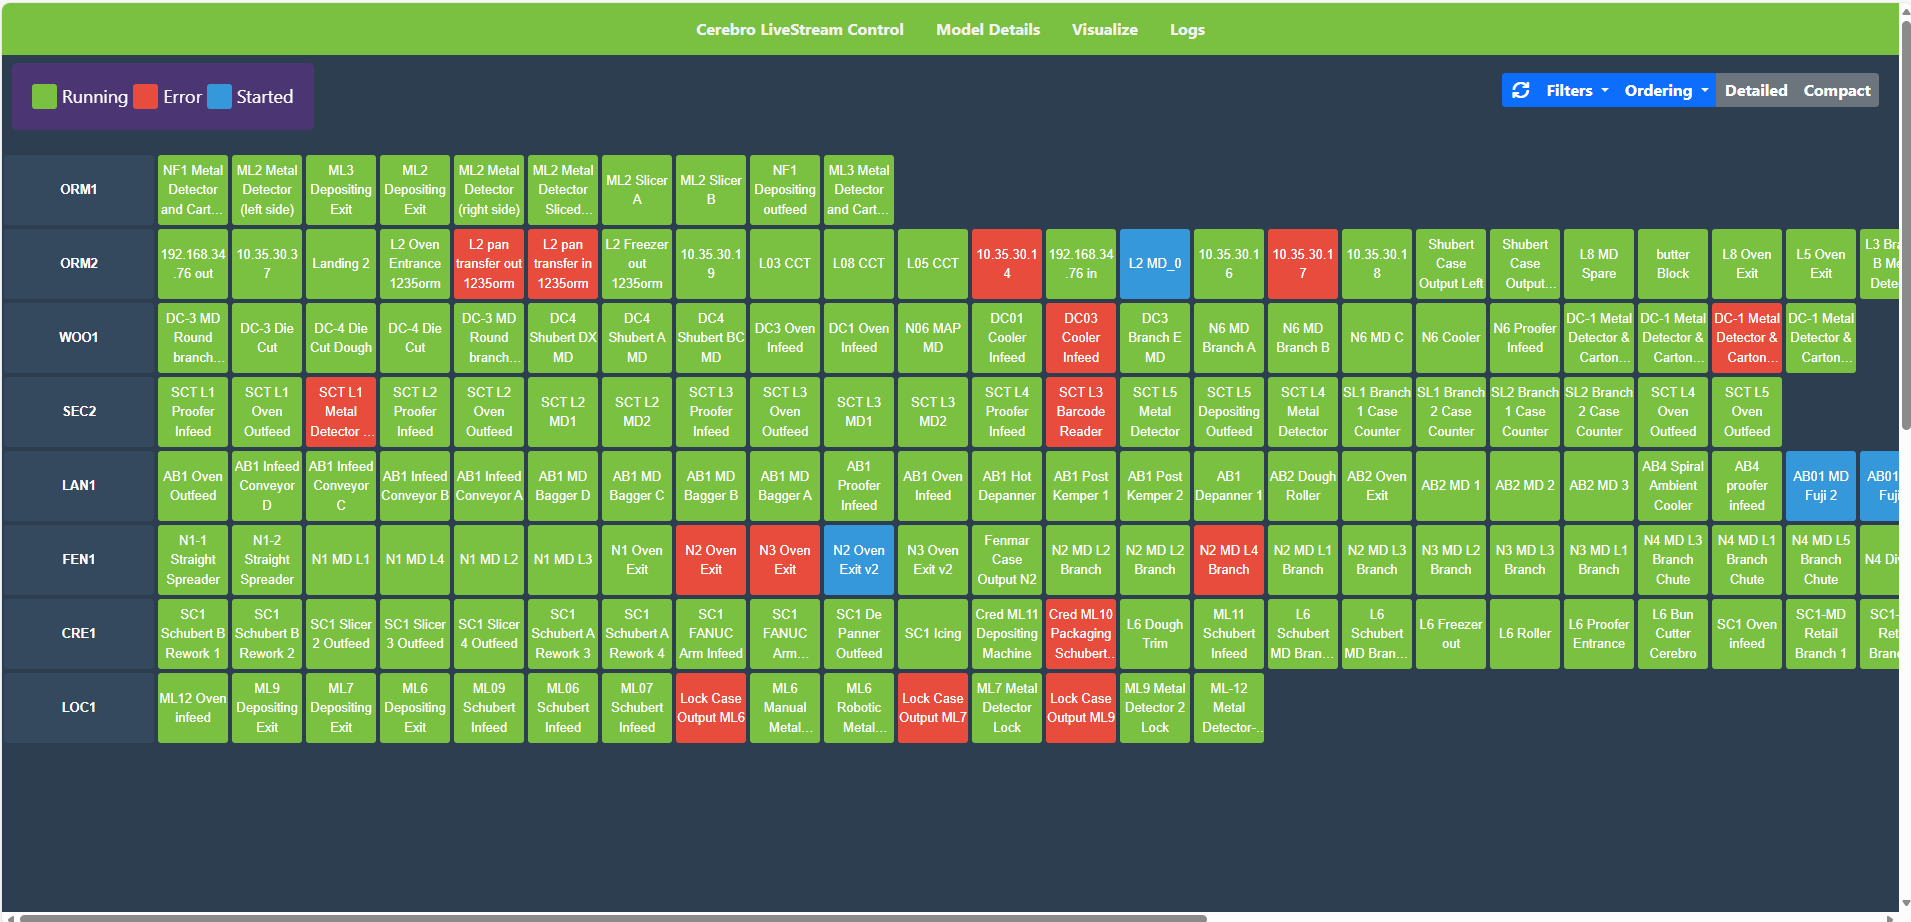
The
Cerebro Factory Super-Intelligence project monitors manufactured goods on the factory lines
and
performs
automated QA and captures product loss using machine vision models. With hundreds of cameras installed
throughout all the different plants, it becomes a challenge to debug issues and understand
points-of-failures.
Originally, all camera statuses where displayed as a Kendo Grid.
In this project, I designed two webpages built in .NET MVC, one for a visualization tool and one to get
ffmpeg
logs from python microservice.
The visualization tool allows management to easily identify problems and notify developers. The
component's
front end is written in Razor and vanilla Javascript and is easily customizable to add additional
filters
and orderings. A python microservice is responsible for gathering and prepping frames into HLS
streamable files(.msu8, .ts). For this project, the service was extended to include REST APIs that
returned
camera feed status and accurate plant locations using Master SQL tables.
C#;dot NET MVC;SQL;
Python;asyncio.py;subprocess.py;threading.py;
flask;JS;JQuery;HTML;CSS;Telerik Kendo UI;ffmpeg
The
Visual Quality System (VQS) Wonderbrands is an app that pulls images from sharepoint and
displays
the acceptable versions of all the products made by wonderbrands. This app replaces the existing Power
App
(that's why it looks the way it does) and is placed on the plant lines where
workers have a constant reference for the acceptable standard for each product.
The biggest challenge
I faced in this project was getting the images from the Sharepoint Site. I used Azure AD and Graph APIs
to
obtain authentication tokens. Graph APIs where used again with the tokens to download images from a
Sharepoint
Site that existed on a different Tenant. I also used Power Automate to create a Flow that will copy any
new
images added to this Site and place in a Blob storage on our company's Tenant. This required some
coordination
between me and the Infra. team and exposed me to different departments within the company.
Querying Sharepoint for the images using the Graph APIs takes a really long time. Thus I optimizes my
solution
by asynchronously downloading images from the front end. My controller would send a "skeleton" webpage
that contained image tags without sources. These sources were later added using AJAX calls and Base64
images.
C#;dot NET MVC;Entity Framework;EDMX;SQL;
Graph APIs;
Javascript;JQuery;Bootstrap;HTML;CSS;Telerik Kendo UI
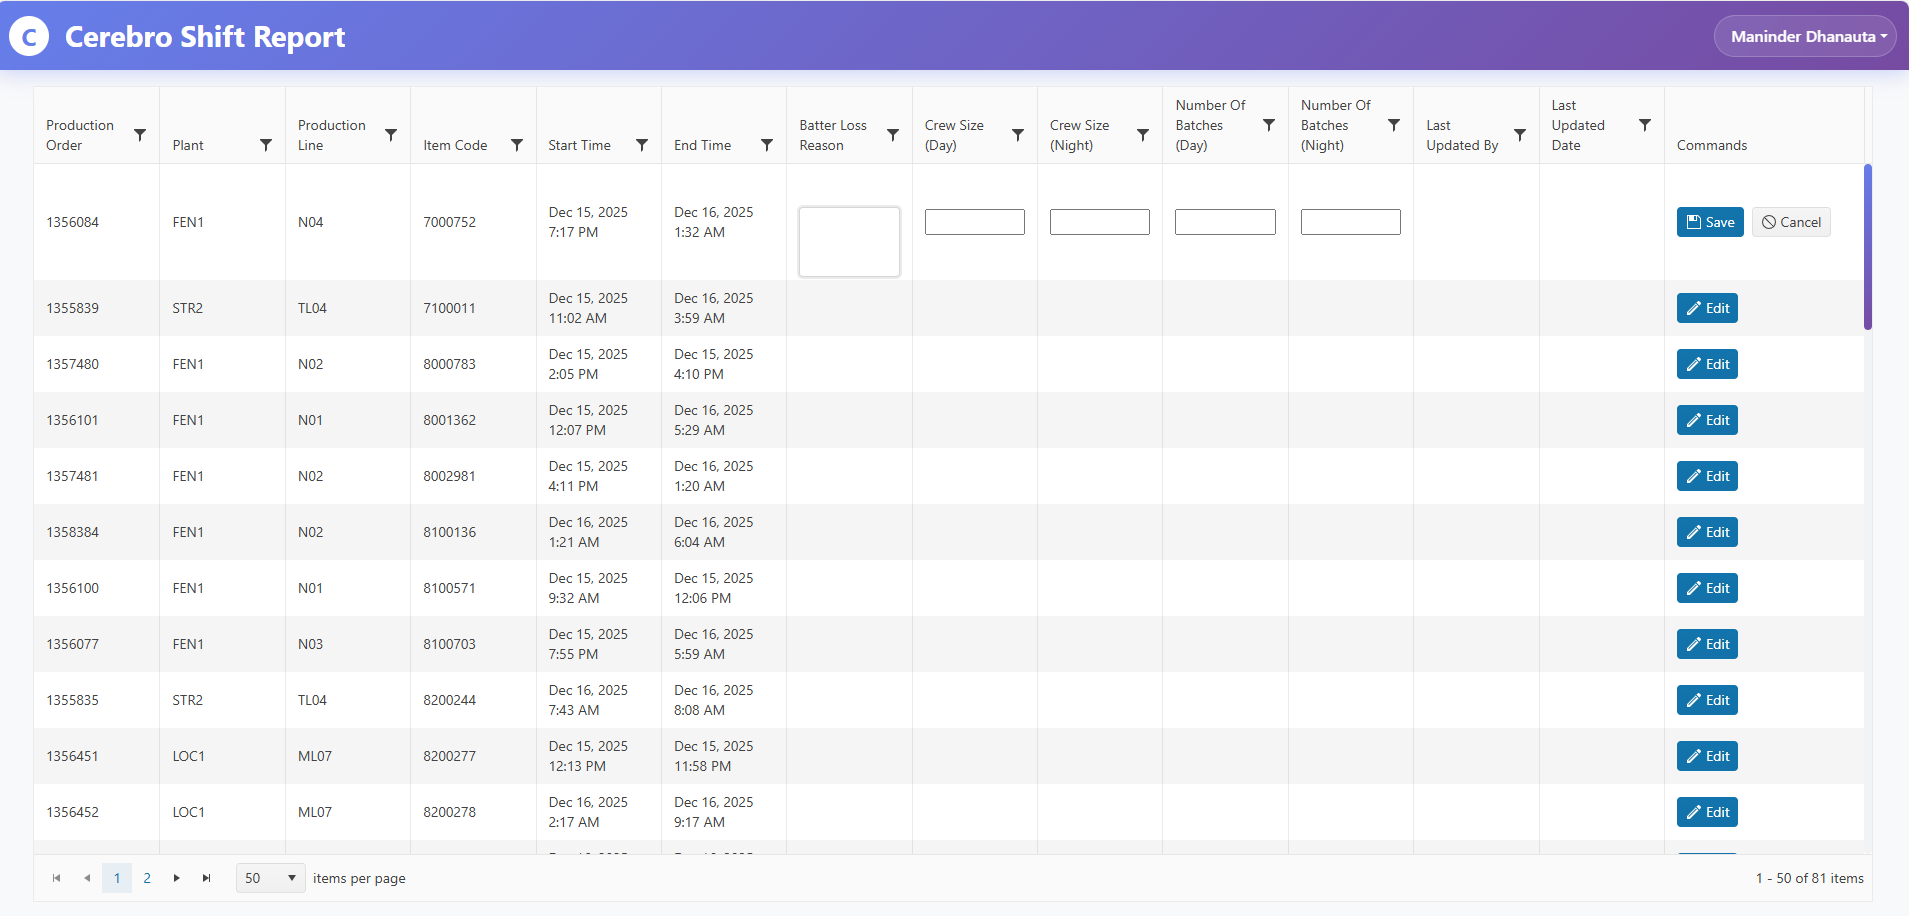
The
Cerebro Shift Report is a standalone webapp used by factory line managers to make data
entries. They
use it
to keep track of batter losses per work shift and additional information regarding the shift. I used a
Kendo
Grid with inline
editing. This simple app uses Microsoft's Entra ID and integrated with company Authorization Management
Portal(AMP).
One particular challenge I overcame was replacing the default inline textbox for Batter Loss Reason to
be text
area. I learnt how to bind input fields to attributes of the data Model in Kendo UI.
C#;dot NET MVC;Entity Framework;EDMX;SQL;Javascript;Bootstrap;HTML;CSS;Telerik Kendo UI